
TABLE 2
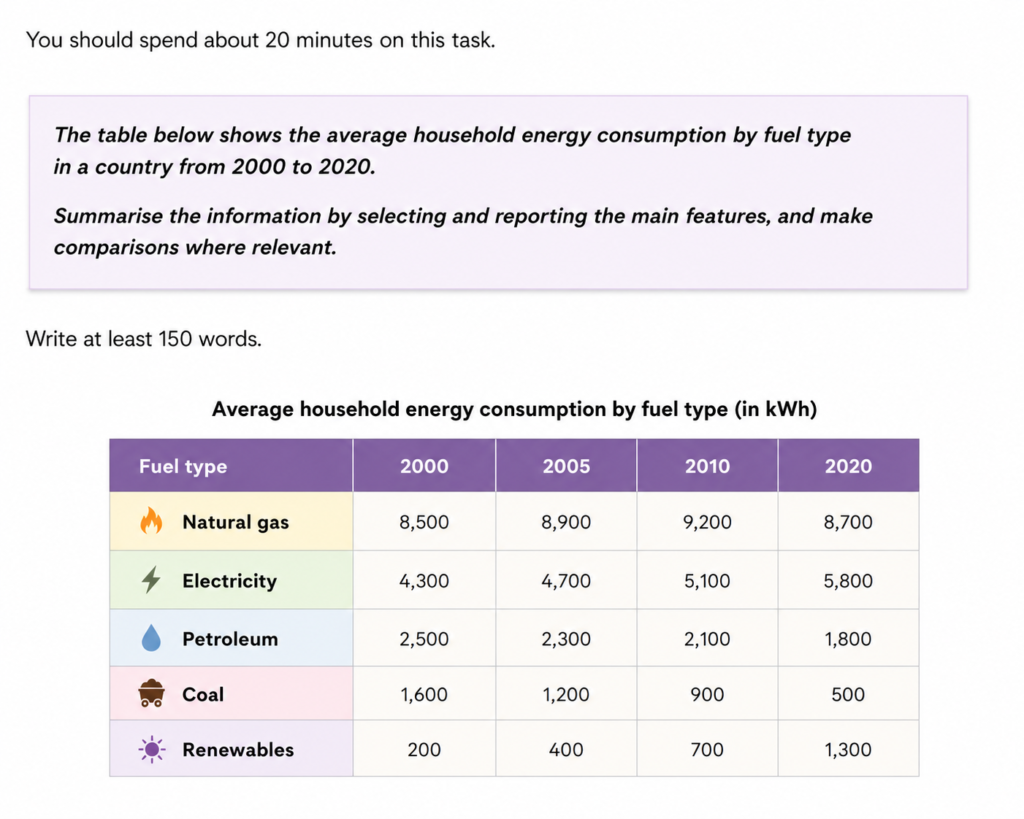
The table compares the average amount of household energy consumed from five different fuel sources in a particular country in 2000, 2005, 2010 and 2020. The figures are given in kilowatt-hours (kWh).
Overall, natural gas was by far the most widely consumed source of energy throughout the period, despite a slight decline towards the end. While the consumption of electricity and renewable energy increased, the figures for petroleum and coal fell steadily. Renewables experienced the most significant proportional growth.
In 2000, households consumed 8,500 kWh of natural gas, almost twice as much as electricity, at 4,300 kWh. Gas consumption then rose gradually to 8,900 kWh in 2005 and peaked at 9,200 kWh in 2010, before falling slightly to 8,700 kWh in 2020. By contrast, electricity consumption increased consistently throughout the period, reaching 5,800 kWh by the final year.
The opposite trend can be seen in petroleum and coal. Petroleum consumption declined steadily from 2,500 kWh in 2000 to 1,800 kWh in 2020, while the figure for coal fell more sharply, from 1,600 to just 500 kWh. Meanwhile, renewable energy followed a strong upward trend, rising from only 200 kWh in 2000 to 1,300 kWh in 2020. As a result, renewables overtook coal to become the fourth most widely used energy source by the end of the period.
Vocabulary to highlight
the average amount of household energy consumed — formal way of describing energy use
by far the most widely consumed — much more widely used than the other sources
throughout the period — during the whole period
a slight decline — a small decrease
fell steadily — decreased consistently
experienced the most significant proportional growth — increased the most relative to its starting figure
almost twice as much as — useful for comparing quantities
rose gradually — increased slowly
peaked at — reached its highest point
by contrast — introduces an opposite or noticeably different trend
increased consistently — continued to rise without falling
the opposite trend can be seen in — useful for introducing categories moving in the other direction
fell more sharply — decreased more significantly
followed a strong upward trend — showed substantial growth
overtook — became higher than another category
by the end of the period — by the final year shown