
You should spend about 20 minutes on this task.
The pie charts below show how men and women spend their free time, according to a survey of adults. Summarise the information by selecting and reporting the main features, and make comparisons where relevant.
Write at least 150 words.
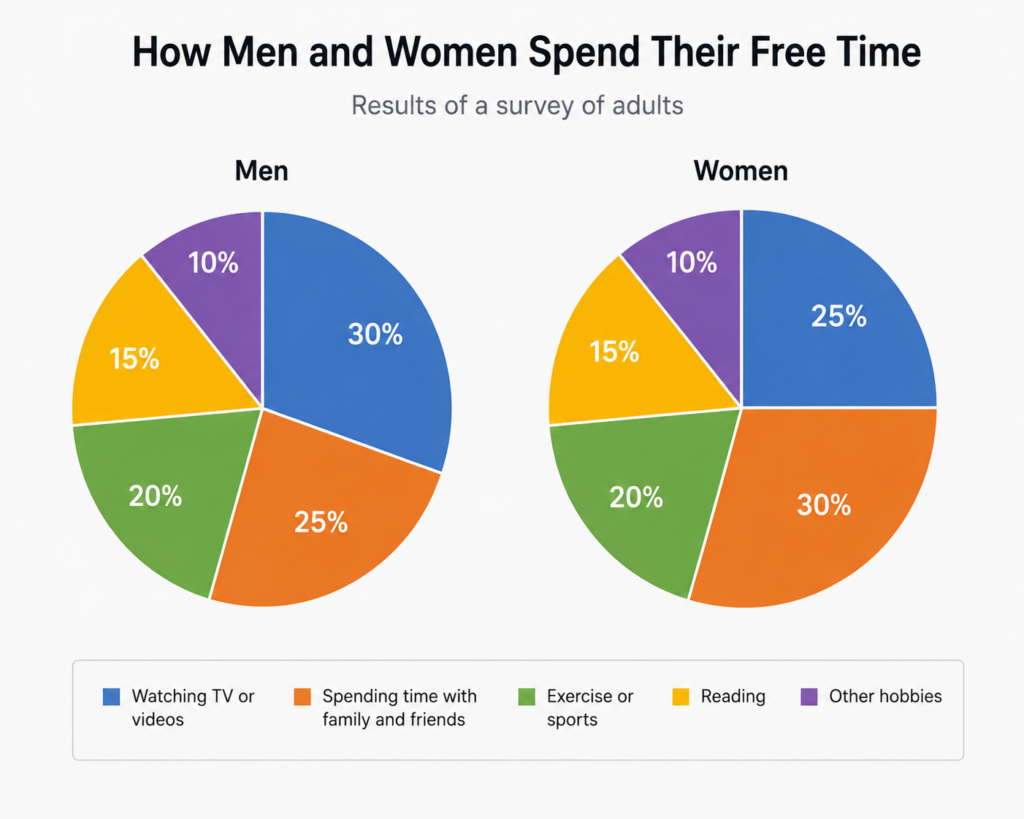
The pie charts compare how male and female adults spend their free time across five different types of activities.
Overall, watching TV or videos was the most popular activity among men, whereas women were most likely to spend their free time with family and friends. However, the differences between the two groups were relatively small, and the proportions for exercise, reading and other hobbies were identical.
Among men, watching TV or videos accounted for the largest proportion of free-time activities, at 30%. Spending time with family and friends was the second most common choice, representing exactly a quarter of the total. Exercise or sports made up a further 20%, while 15% of men’s free time was spent reading. Other hobbies were the least common category, at just 10%.
The pattern for women was slightly different. Spending time with family and friends ranked first, accounting for 30%, which was five percentage points higher than the figure for men. By contrast, watching TV or videos represented 25% of women’s free time, compared with 30% among males. There were no differences in the remaining three categories, with exercise or sports, reading and other hobbies accounting for 20%, 15% and 10% respectively.
Vocabulary to highlight
- spend their free time — use their leisure time
- across five different types of activities — in five different categories
- the most popular activity among — the activity with the highest proportion for a group
- were most likely to — most commonly did something
- relatively small — fairly minor
- the proportions were identical — the percentages were exactly the same
- accounted for the largest proportion — represented the highest percentage
- the second most common choice — the category with the second-highest figure
- representing exactly a quarter — accounting for precisely 25%
- made up a further 20% — accounted for another 20%
- the least common category — the category with the lowest percentage
- the pattern was slightly different — the distribution differed somewhat
- ranked first — had the highest figure
- five percentage points higher than — e.g. 30% compared with 25%
- by contrast — introduces a difference
- compared with — useful for making direct comparisons
- there were no differences in — the figures were the same
- respectively — in the same order as the categories mentioned