
You should spend about 20 minutes on this task.
The pie charts below show how households used water for five different purposes in a country in 2000 and 2020. Summarise the information by selecting and reporting the main features, and make comparisons where relevant.
Write at least 150 words.
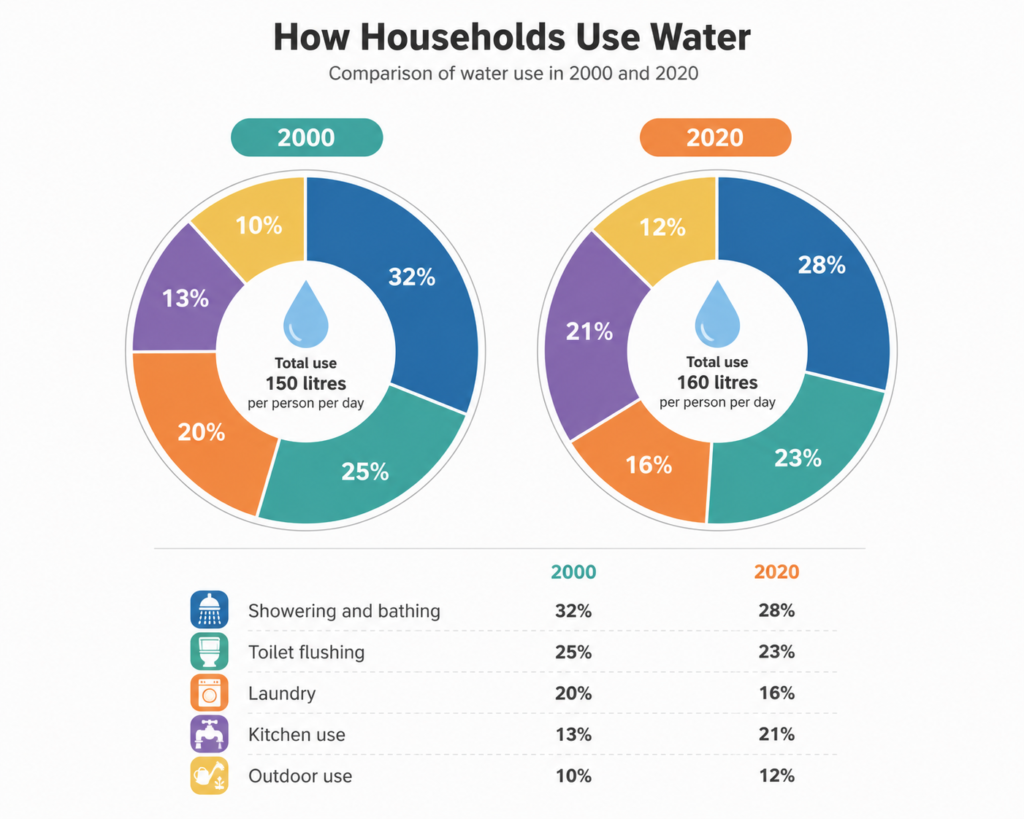
The pie charts compare how household water was used for five different purposes in a particular country in 2000 and 2020. The figures are given as percentages of total household water consumption.
Overall, showering and bathing accounted for the largest proportion of water use in both years, although its share decreased slightly. By contrast, kitchen and outdoor water use became more common, with the former experiencing the most significant increase. Total daily water consumption also rose slightly over the period.
In 2000, showering and bathing made up 32% of household water consumption, followed by toilet flushing at 25%. Laundry was responsible for a further 20%, while considerably smaller proportions were used in the kitchen and outdoors, at 13% and 10% respectively. Overall, households consumed an average of 150 litres of water per person per day.
By 2020, the proportion used for showering and bathing had fallen moderately to 28%, although it remained the largest category. Similarly, toilet flushing declined slightly to 23%, while laundry fell from 20% to 16%. In contrast, kitchen use increased considerably from 13% to 21%, an eight-percentage-point rise. Outdoor use also grew slightly, reaching 12%. Meanwhile, total consumption increased from 150 to 160 litres per person per day.
Vocabulary to highlight
- accounted for the largest proportion — represented the biggest percentage
- its share decreased slightly — its percentage became a little lower
- by contrast — introduces an opposite trend
- became more common — increased
- experienced the most significant increase — showed the largest rise
- over the period — during the period shown
- made up 32% — represented 32% of the total
- followed by — used to introduce the next largest category
- was responsible for — accounted for
- considerably smaller proportions — much lower percentages
- by 2020 — useful for describing the later year
- remained the largest category — continued to have the highest proportion
- declined slightly — decreased a little
- in contrast — introduces a different trend
- an eight-percentage-point rise — an increase from 13% to 21%
- reaching 12% — increasing to a final figure of 12%