
You should spend about 20 minutes on this task.
The bar chart below shows the average daily sales of five food and drink items at Sunny Day Café in winter and summer. Summarise the information by selecting and reporting the main features, and make comparisons where relevant.
Write at least 150 words.
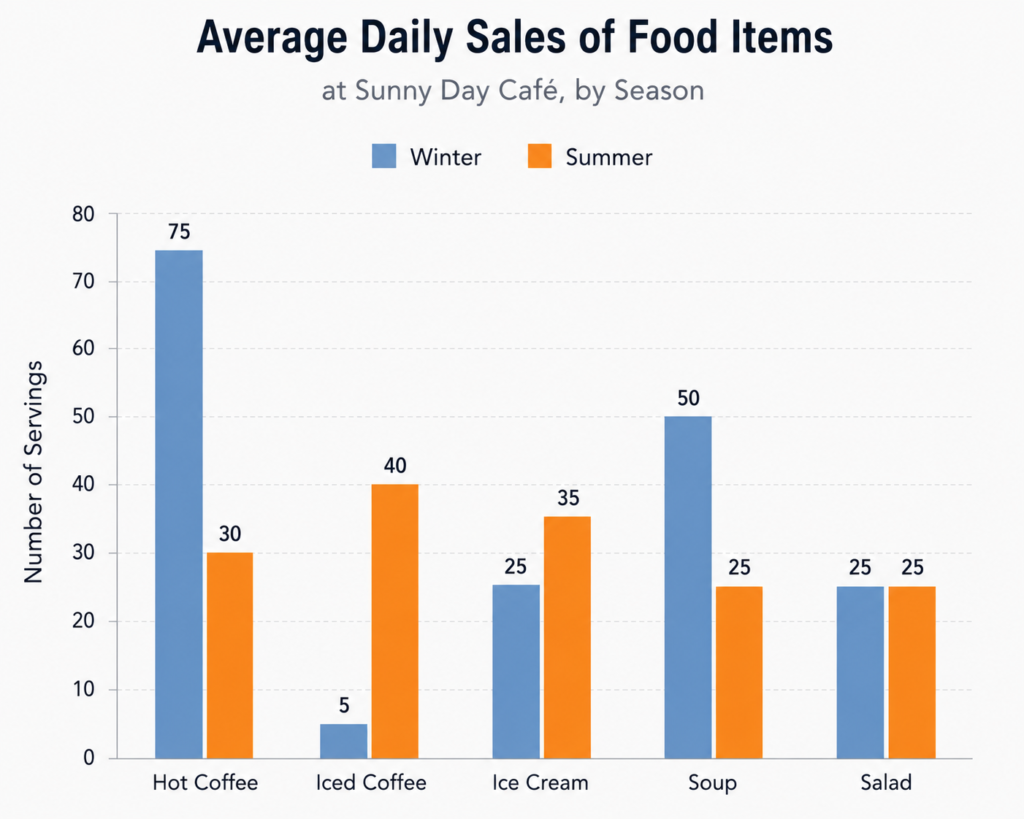
The bar chart compares the average daily sales of five items at Sunny Day Café in winter and summer.
Overall, sales patterns varied considerably between the two seasons. Hot coffee and soup were clearly more popular in winter, while iced coffee and ice cream sold in greater quantities during summer. Salad was the only item whose sales remained the same in both seasons.
In winter, hot coffee was by far the best-selling item, with 75 servings sold per day. Soup ranked second at 50 servings, while both ice cream and salad recorded much lower figures of 25. Iced coffee was the least popular item during this season, with only 5 servings sold daily.
In summer, however, iced coffee became the café’s most popular item, rising sharply to 40 servings per day. Ice cream sales also increased, reaching 35 servings. By contrast, demand for hot coffee fell substantially from 75 to 30 servings, while soup sales dropped from 50 to 25. Salad showed no change, remaining stable at 25 servings per day.
Vocabulary to highlight
- sales patterns varied considerably — the general pattern was quite different
- sold in greater quantities — had higher sales
- remained the same — did not change
- by far the best-selling item — clearly the item with the highest sales
- ranked second — had the second-highest figure
- recorded much lower figures — had considerably smaller numbers
- the least popular item — the item with the lowest sales
- rising sharply to — increasing significantly to
- by contrast — introduces an opposite pattern
- fell substantially — decreased considerably
- dropped from … to … — useful for describing a decline
- remained stable at — stayed unchanged at a particular figure