
You should spend about 20 minutes on this task.
The pie charts below show the most common advantages and disadvantages of Greenfield City, according to a survey of visitors.Summarise the information by selecting and reporting the main features, and make comparisons where relevant.
Write at least 150 words.
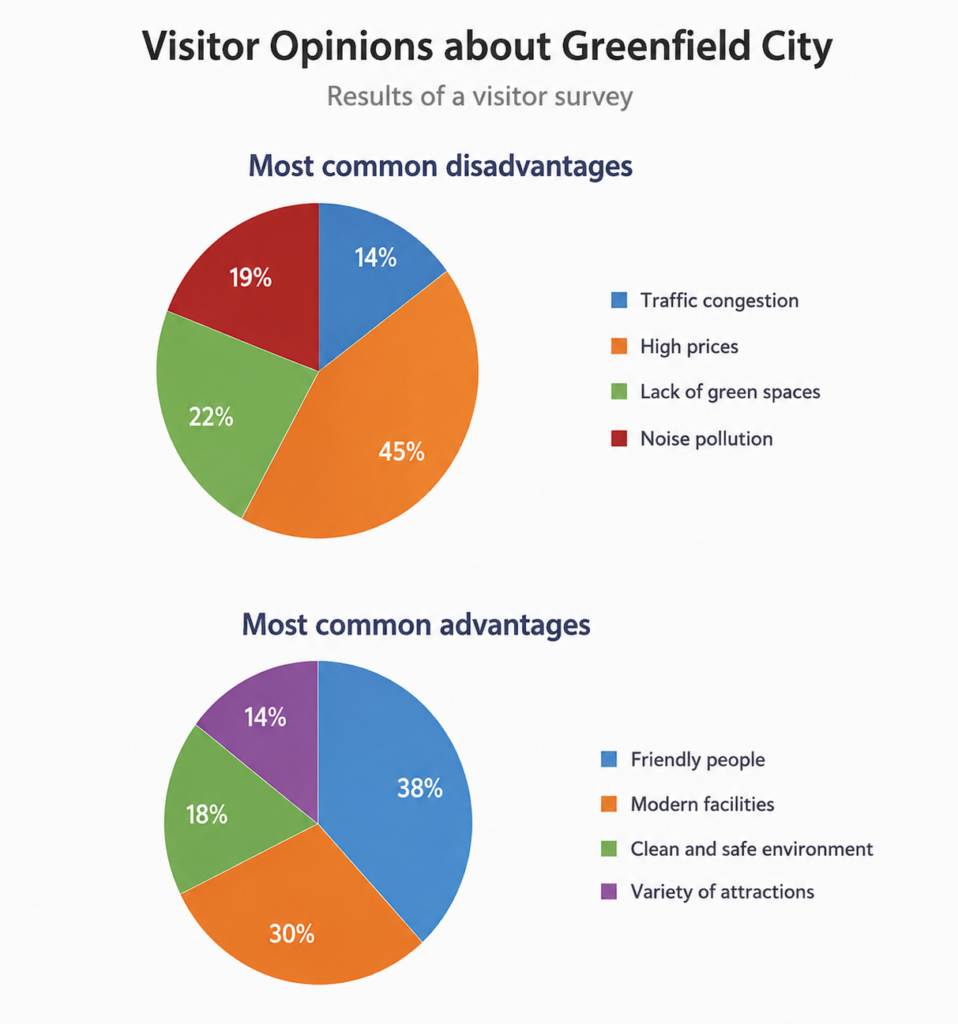
The pie charts illustrate the most commonly reported advantages and disadvantages of Greenfield City, based on the results of a survey of visitors.
Overall, high prices were by far the most frequently mentioned disadvantage, while traffic congestion was the least common complaint. In terms of positive aspects, friendly people accounted for the largest proportion of responses, followed by modern facilities.
Regarding the disadvantages, 45% of visitors identified high prices as the main negative feature of the city. This was more than twice the proportion who complained about a lack of green spaces, at 22%. Noise pollution was mentioned by a further 19% of respondents, while traffic congestion was the least commonly reported problem, accounting for just 14%.
As for the advantages, friendly people received the highest proportion of responses, at 38%. Modern facilities were also viewed positively, being mentioned by almost a third of visitors, at 30%. A clean and safe environment accounted for a considerably smaller proportion, at 18%. Finally, the variety of attractions was the least frequently mentioned advantage, representing the remaining 14%.
Vocabulary to highlight
- the most commonly reported — mentioned most frequently
- based on the results of a survey — according to survey findings
- by far the most frequently mentioned — much more commonly mentioned than the others
- the least common complaint — the problem mentioned by the fewest people
- in terms of — regarding / when considering
- positive aspects — advantages
- accounted for the largest proportion — represented the highest percentage
- regarding the disadvantages — useful for introducing one chart
- identified X as — selected or described something as
- more than twice the proportion — over two times the percentage
- a further 19% — an additional 19%
- respondents — people who took part in a survey
- as for the advantages — useful for moving to the second chart
- received the highest proportion of responses — was selected by the largest percentage
- almost a third — close to 33%
- a considerably smaller proportion — a much lower percentage
- the least frequently mentioned — selected by the smallest proportion
- representing the remaining 14% — accounting for the final 14%